Uptime, health, errors, users, and a message when it breaks.

Five questions cover most of what a small team needs from monitoring. The first is answered from Lumin's servers before you install anything. Three are answered by one agent on your host, with no SDK in your services. The question about users needs one small package in your web or mobile app.
Get startedRead the quickstart
10 minutes to first chart · two labels on your compose file
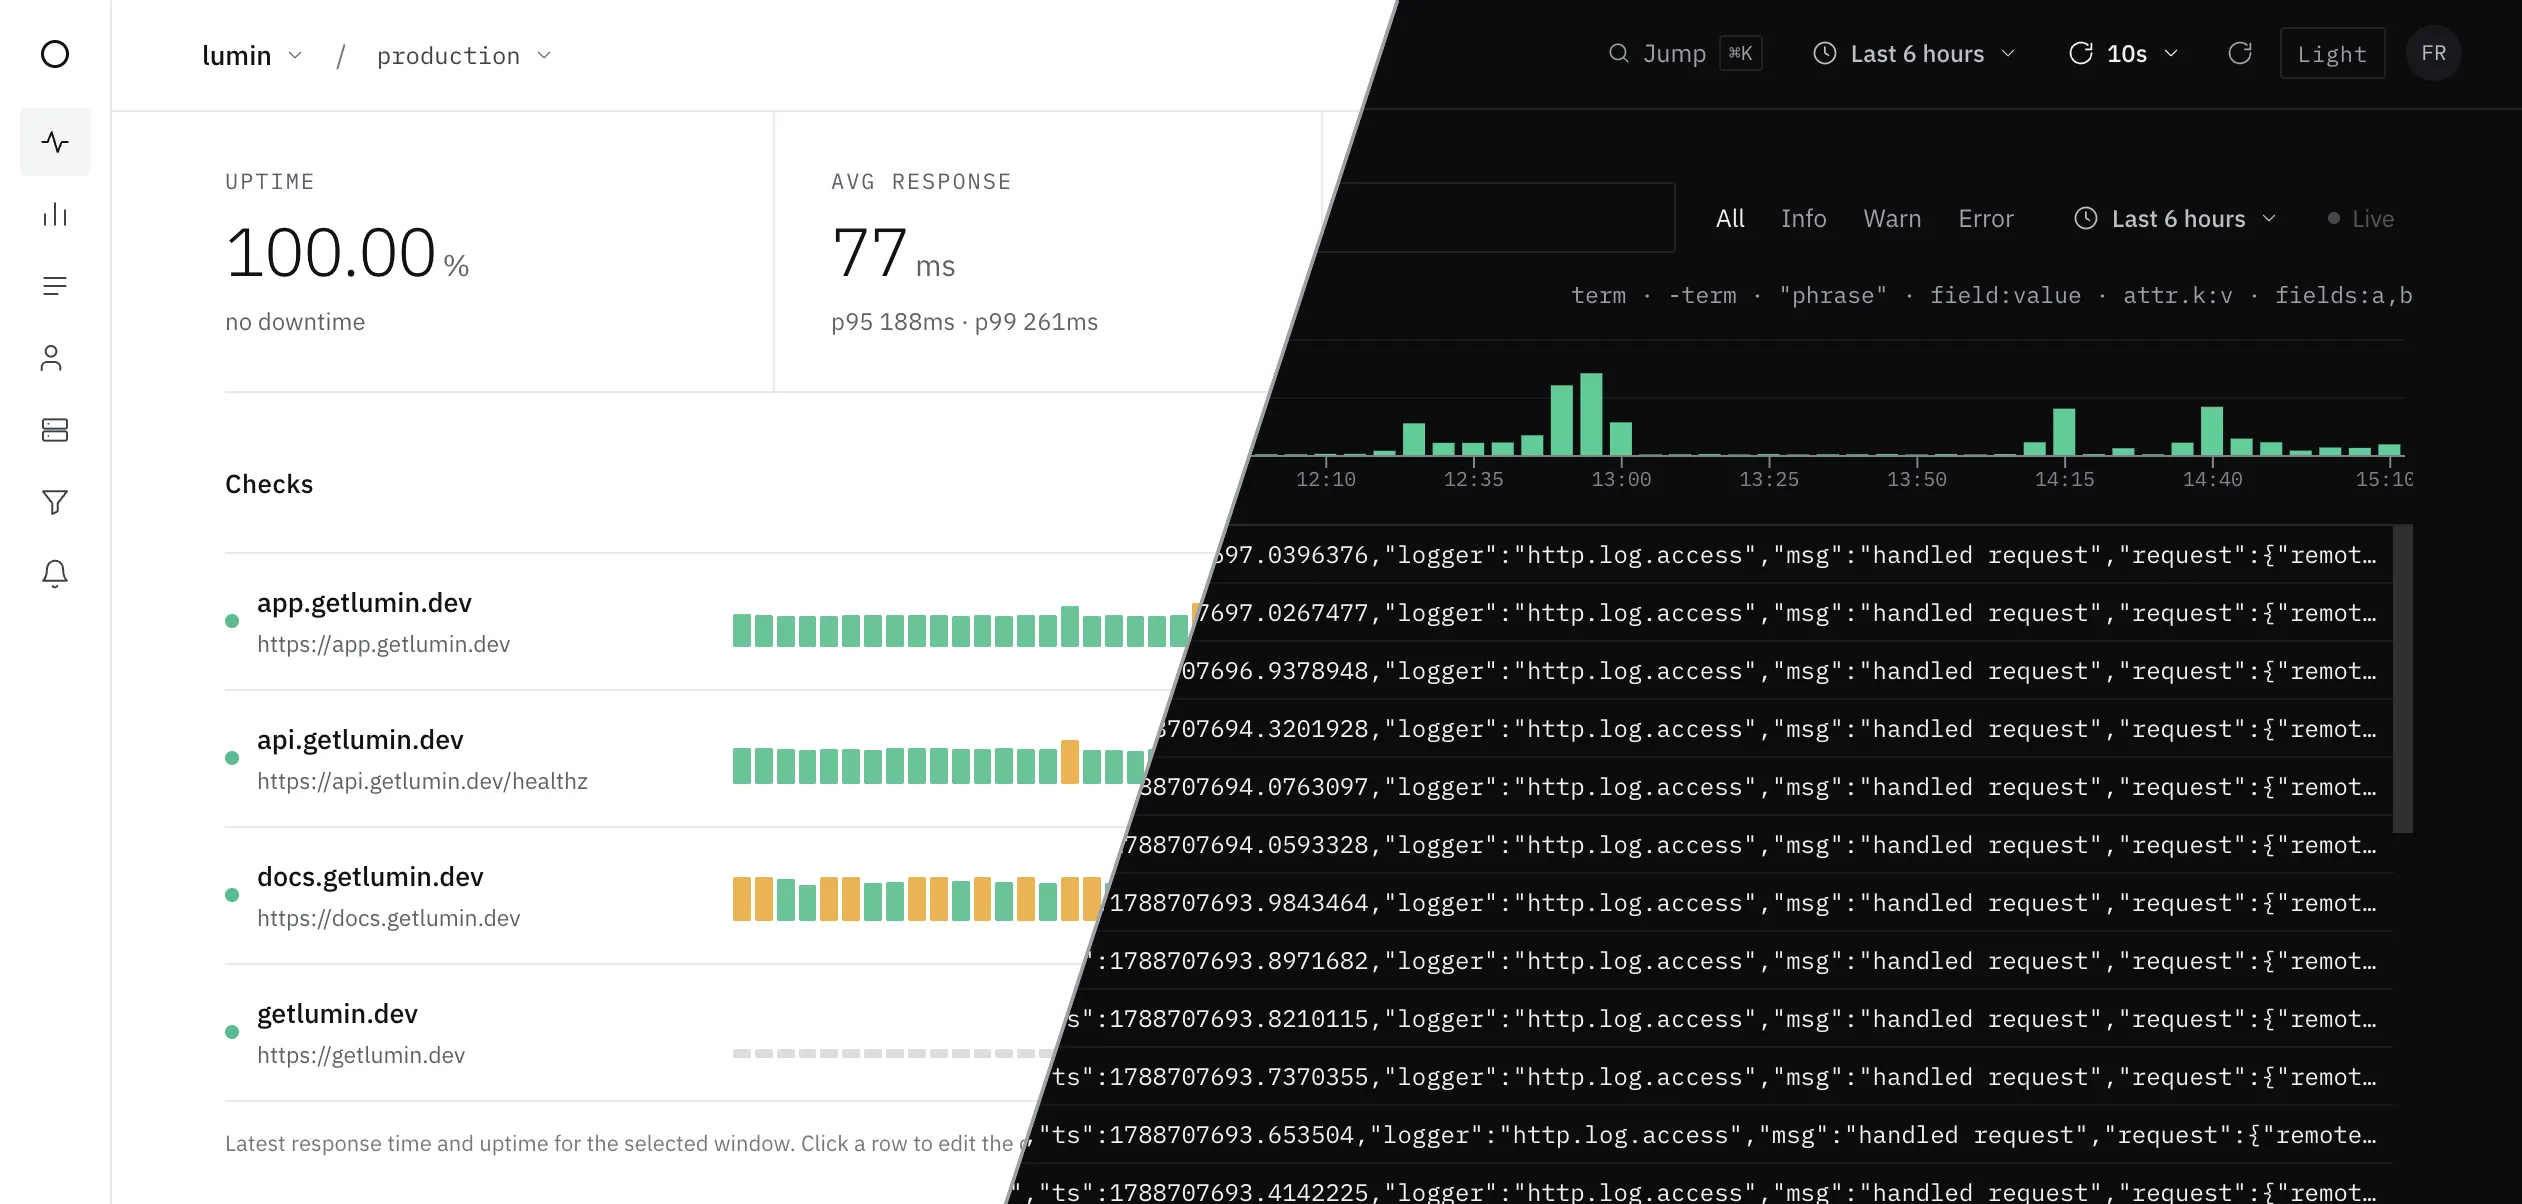
The Lumin dashboard, split diagonally between the light and the dark theme. The light half shows the uptime checks page with four monitors at 100 percent uptime. The dark half shows the logs explorer with a live tail of structured request logs.
docker-compose.yml
services: spring-api: image: acme/spring-api:1.4.2+ labels:+ lumin.metrics: "true"+ lumin.metrics.framework: "spring"+ lumin-agent:+ image: luminmonitor/lumin-agent:latest+ environment:+ LUMIN_API_KEY: "lmn_priv_…"+ DOCKER_HOST: tcp://lumin-docker-proxy:2375+ lumin-docker-proxy: # read-only, allowlisted+ image: wollomatic/socket-proxy:1.13.1+ user: "0:0"+ environment:+ SP_LISTENIP: 0.0.0.0+ SP_ALLOWFROM: lumin-agent+ SP_ALLOW_HEAD: /_ping+ SP_ALLOW_GET: '/v1\.[0-9]+/containers/(json|[0-9a-f]{64}/(json|stats|logs))'+ volumes:+ - /var/run/docker.sock:/var/run/docker.sock:ro

That dashboard cost you 18 lines.

  • No image rebuilt, and no SDK added to a service you run.
  • One Docker socket, read-only and behind an allowlisting proxy.
  • The agent finds every labeled container on its own.
  • Compose is optional. docker run, Swarm, and Coolify work the same.

Then run docker compose up -d

What each one looks like in the app.

01

Is my site up?

An HTTP check from Lumin's servers, every 30 seconds to 15 minutes, against any URL you give it. Nothing to install for this one. The dashboard opens on uptime, average response, and incidents per check, and a slow answer past your threshold shows as degraded, not just down.

02

Is my service healthy?

Request rate, error rate, and latency per route, next to CPU and memory for every container and disk for every host.

03

What is in the error log?

Tailed straight from container stdout and stderr, with the service and level already parsed. Filter on either, search the message text, and follow it live. Unhandled browser and mobile errors are captured with no code of yours, and land in the session that hit them.

04

What are users doing?

Sessions, page and screen views, and custom events from @lumin-monitor/browser or @lumin-monitor/react-native. Each is under 6 kB gzipped, and both write into the same project.

05

Who tells me when it breaks?

A rule watches one metric, or counts how often a log pattern matches inside a window. Cross the threshold and Lumin posts to the Slack channel you connected, with the condition and the value that tripped it. It posts again when the value recovers.

What the agent does on your host.

Label the services you care about. The agent scrapes their /metrics endpoints, tails their stdout, and snapshots the host every 15 seconds.

01 · your docker-compose

7 services, 5 labeled

spring-api/metrics + logs
gin-api/metrics
postgreslogs
redislogs
caddylogs
workernot labeled
mailernot labeled

A label, not a compose file. Compose is the short path, and docker run, Swarm, and Coolify label a container just as well.

02 · lumin-agent

One agent, three jobs

luminmonitor/lumin-agent
scrape/metrics endpoints
tailstdout / stderr
snapshothost + container stats

It reads the Docker API through lumin-docker-proxy, which forwards only the five read requests that the agent makes. The agent never touches the socket.

03 · app.getlumin.dev

Live in 10 minutes

  • Per-service charts for request rate, errors, latency, and saturation.
  • Searchable logs from every labeled container.
  • Host and container CPU, memory, and disk.
  • Slack alerts on any metric, or on a log pattern.

Uptime checks are the one thing on the dashboard the agent does not produce: Lumin probes your URLs from its own servers, agent or no agent.

Works with what you already run.

Lumin picks up anything that serves a Prometheus /metrics endpoint or writes logs to stdout. The five named below have an adapter that maps their metric names onto the three RED charts: request rate, errors, and duration.

StackSetupWhat you get
Spring Boot2 deps + 3 settingsRED, plus JVM and pool series
Ginclient_golang + a middlewareRED
Expressprom-client + a middlewareRED
FastAPI1 pip install + 5 linesRED
Axumaxum-prometheus layerRED
Anything elseexpose /metricsYour metric names, charted as they are
Off-the-shelf (Caddy, Postgres)just the lumin.logs=true labelLogs tailed

What each one asks you to change.

Other tools want their SDK inside every service image and their collector next to it. Lumin wants two labels and two small containers, both shown above.

Datadog, typical setup

touches every service
# Dockerfile, in every service RUN pip install ddtrace # entrypoint, in every service CMD ["ddtrace-run", "python", "app.py"] # docker-compose.yml datadog-agent: image: gcr.io/datadoghq/agent:7 environment: DD_API_KEY: "…" DD_APM_ENABLED: "true" volumes: - /var/run/docker.sock:/var/run/docker.sock:ro - /proc/:/host/proc/:ro - /sys/fs/cgroup/:/host/sys/fs/cgroup:ro
Every service image is rebuilt and redeployed before you see a single chart.

Lumin

touches one file
# docker-compose.yml — the entire change + two labels on each service you want watched + one lumin-agent container + one socket-proxy, read-only # what you do not touch no Dockerfile edited no image rebuilt no SDK added to a service you run # not on Compose? the same two labels docker run, Swarm, Portainer, Coolify
Your service images are untouched. Lumin scrapes the endpoint they already expose. Compose is the short path, not a requirement.

Your production data, inside Claude Code.

Lumin runs a read-only MCP server. Point Claude Code, Cursor, or VS Code at it with one command, then ask about production in the editor you already have open. Ten tools cover logs, metrics, uptime checks, alerts, infrastructure, and browser errors.

Connect once

read-only
# one command, in the project you are working on claude mcp add --transport http lumin \ https://api.getlumin.dev/v1/mcp \ --header "Authorization: Bearer lmn_read_…" # then, in the editor you already have open > the checkout endpoint got slow after this morning's deploy. what happened?
The key reads one project and writes nothing. Lumin sends nothing to a model provider. Your agent asks, and Lumin answers with your own data. Setup for every client.

Flat tiers. No per-GB anything.

Pick a tier by the number of services you run. That is a number you can count today, so the bill never moves on you. Logs, metrics, sessions from web and mobile, uptime checks, and the MCP server come with every tier.

Hobby
€0/month
For side projects and proof-of-concepts.
  • 1 project, 1 service
  • Logs, metrics, web and mobile sessions
  • Uptime checks
  • MCP server for coding agents
  • 7-day retention
  • No alerts
Get started
Solo
€19/month
For one person shipping a real product.
  • 1 project, 5 services
  • Logs, metrics, web and mobile sessions
  • Uptime checks
  • MCP server for coding agents
  • 30-day retention
  • Alerts on logs and metrics
Get started
Studio
€99/month
For an agency or a freelance operator who looks after client machines.
  • Unlimited projects, 50 services
  • Logs, metrics, web and mobile sessions
  • Uptime checks
  • MCP server for coding agents
  • 12-month retention
  • Alerts on logs and metrics
  • Priority support by email
Get started

Prices are in euro and exclude VAT. Every account starts on the free Hobby tier, and you can upgrade from the billing screen when you need more. Signing up needs no card. The Terms of Service and the Privacy Policy apply to every account.